From Data Visualization to Data Spatialization in Architecture
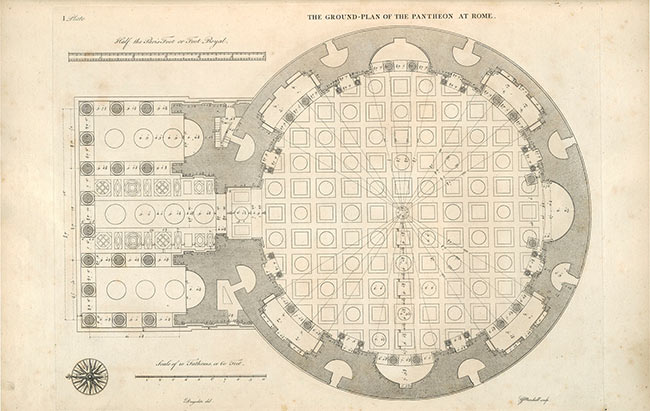
A relationship between the fields of data visualization and architecture has existed for hundreds of years. This relationship dates as far back as the late 17th century, as evidenced in French architect’s Antoine Desgodetz architectural publication, Les edifices antiques de Rome dessinés et mesurés très exactement (The ancient buildings of Rome designed and precisely measured). The publication serves as one of the earliest examples of the confluence of design and art and allowed students to clearly visualize their potential work.

Data visualization allows the architect a way to experience what is going to be built without having the ability to step inside of the structure. It also allows freedom to create and conceptualize different types of design elements that can be incorporated into the design process in order to achieve innovation in design and style. The relationship between data visualization and architecture, as well as the interplay of data spatialization in architectural design is a fascinating one.
About Data Visualization and Spatialization
It is important to have a base understanding of data visualization as well as spatialization. Data visualization is simply defined as presenting data in a visual or pictorial form. Many of the earliest examples of data visualization are still commonly in use today in the form of maps and charts, such as those use to explore new lands or to chart the solar system. Spatialization takes large sets of data and imagines it in three dimensions, through the use of software. Spatialization takes visualization to a new frontier by giving depth to data and bringing it nearly to life.
Rise of Data Spatialization in Architecture
Spatialization is the natural extension of data visualization and has become an emerging trend in architecture. Because of the layers and dimensions added to a concept, based on the available spatialization software for your architectural design, spatialization can stretch the boundaries of what is possible in terms of your ideas and what you want to ultimately build. The move toward incorporating big-data with the assistance of computerized programs that can analyze and synthesize this data into a brilliant new structure that stretches the known boundaries of architecture.
Data spatialization allows for the depiction of data as art as well as an intricate design element. The incorporation of this data gives a unique look to an architectural structure and is being heralded as the latest innovation in architectural design. The instances of data spatialization as a design element in architecture suggests that the trend is catching on.
The Use of Data Visualization as the Core of Architectural Design
Just as it was in the late 17th century with Antoine Desgodetz’s publication, the visualization of design is a basic underlying concept to architecture. A concept that appears in one’s head is easier to grasp when the data comprising that concept can be translated into a visual representation as oppose to attempting to describe what you have envisioned. Using data visualization to bring life to a concept and adding depth through spatialization gives the depth and perspective needed to take architectural design to a completely new arena.


 Andrew


